In yesterdays preview of Stoke (link) I threw in a plot showing how they compared to teams that have been relegated from the Premiership which I figure is worth some elaborating on.
To quickly recap, a teams total shots ratio is calculated as follows:
Total shots ratio (TSR) = Total shots for/(Total shots for + Total shots against)
The higher a teams TSR the more they control the ball. The importance of TSR lies in it’s predictive ability – being the best stat I have for predicting a teams future performance (link).
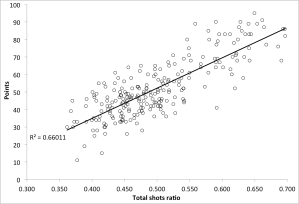
The crux of the plot is reproduced in the plot below: the relationship between points and total shots ratio.
The correlation is pretty strong here but that’s not necessarily the point. The take-away message is that teams that control the ball will gain better results and thus more points.
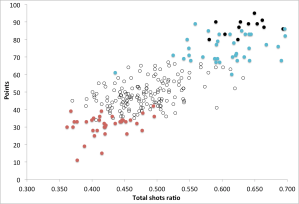
Lets go ahead and colour that plot in a bit. So below black represents the title winners, blue represents the teams that qualified for the champions league and red represents teams that were relegated.
There’s a pretty clear pattern here – those teams that control less of the ball (i.e., those to the left of the plot) are far more likely to be relegated whereas it’s very hard to win the league, or qualify for the champions league, without controlling a majority of the ball. The only real outlier is the blue spot to the left of the plot – being Everton’s qualification in ’04-05.
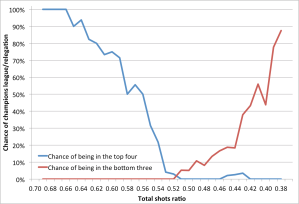
Finally we can break this plot down and determine the probability of qualifying for the champions league/being relegated based on a teams TSR. To eliminate some of the noise the data is plotted as a three point moving average.
There’s not a lot of overlap there – it paints a pretty clear picture that controlling the ball is an integral part of being a successful team.


Pingback: A quick look at Total Shots Ratio « Experimental 3-6-1
Pingback: The quest to manage the ‘state of emergency’ « The Width of a Post
Interesting read and analysis.
As I understand it, having a high TSR implies only that a team consistently outshoots it’s opponents. Thus, can you please clarify/define what is meant by “control of the ball”.
I.e. In your conclusion you’ve stated: “controlling the ball is an integral part of being a successful team”.
I would say that your analysis suggests that out shooting your opponents is positively correlated with success; rather than “controlling the ball”, if by “controlling the ball” you are referring to possession, or a varient of a possession statistic.
Thank you for clarifying.
I’m using shots as a proxy for possession. More specifically possession in the valuable, attacking areas of the pitch
Can you find a statistical correlation between maintaining a higher rate of possession (or a higher ratio of possession in “attacking areas” – e.g. attacking 1/3rd) and having a higher TSR?
If that has been demonstrated, I would agree that TSR could be a proxy for possession (or attacking possession). It would stand to reason that having a higher ratio of “Attacking Possession” (e.g. Attacking Possession (AP) = (time in attacking 1/3rd)/(time in attacking 1/3rd + time in defensive 1/3rd)) would result in a team having a higher TSR; however, if that is not the case, or if it has not been demonstrated, I don’t think you can necessarily state that having a high TSR implies anything about a team’s possession of the ball.
In which case, I think the conclusion of this analysis would be: teams who outshoot their opponents win more games, and the greater the discrepancy between shots for and shots against (i.e. the higher the TSR), the better a team will finish over the course of a season.
Food for thought anyways.
In terms of predictions based on TSR, with just under 1/3rd of the season played I did a quick calculation of team’s TSRs (stats from http://www.whoscored.com) which yielded the following (in descending order):
Man City 0.662
Arsenal 0.620
Everton 0.617
Liverpool 0.609
Tottenham 0.597
Man United 0.562
Chelsea 0.540
Newcastle U 0.488
Norwich 0.487
Fulham 0.485
Swansea 0.474
West Ham 0.468
Southampton 0.466
Wigan 0.449
QPR 0.444
WBA 0.439
Stoke 0.421
Aston Villa 0.405
Reading 0.374
Sunderland 0.332
If you compare this to the current premier league table it appears Arsenal, Liverpool, Newcastle, Norwich, Southampton, and QPR are all under-performing relative to their TSR, whereas Man Utd, Chelsea, West Ham, and Sunderland are all currently overachieving. One would suspect that in most cases teams’ performance relative to their TSR will regress to the mean, and thus you could predict that these teams are due to for a correction as the season progresses.
It would be interesting to derive a prospective prediction model based on the TSR by establishing a confidence interval for how much a team’s TSR is likely to change, at any point over the course of a season (likely very little by 1/3rd or 1/2 way though).
Pingback: Shots On Target Difference | Bass Tuned To Red
Pingback: Is playing style important? | 2+2=11