This is the latest in a series of posts looking at which team level metrics are repeatable from season-to-season in the Premiership. The following three paragraphs are generic for the series, feel free to skip.
As I’ve said before, it’s all well and good knowing that team ‘x’ took 20 shots in the first half against team ‘y’, but unless we know whether the number of shots a team takes is repeatable over time then trying to put that number into context is essentially useless (a point that is made far more eloquently by Richard Whittall in this column).
Ultimately, determining how repeatable a metric is allows it to be broken down into a ‘skill’ component – something that teams can control – and a ‘luck’ component – something teams have no control over. (For the story so far see I’ve placed a summary table at the bottom of this post, which I’ll continue to update in the future). Whilst those that are dominated by luck are wonderful insofar as it’s funny to watch the media play out narratives that can be explained very simply by regression towards the mean over time, those that are dominated by skill tell us something useful about the team posting the numbers, which will be repeated season after season, and thus are the metrics we should truly be interested in.
The theory here in this series is pretty simple. I take a big group of teams and compare how well the value they record for a given metric in one season correlates to the same metric the following season, and determining the correlation coefficient (R value) of a plot with year ‘n’ on the x axis and year ‘n+1’ on the y axis allows the breakdown of a metric into skill and luck components to be established. The sample comprises of the 204 pairs of ‘back-to-back’ team Premiership seasons that have occurred since the beginning of the ’00-01 Premiership season (17 non-relegated teams per season x 12 back-to-back seasons).
This time I’m focussing on the shots on target a team takes and allows. For the record I’ve demonstrated before that shots on target are important in determining a teams final league position and that they are repeatable from early on in the season. I’ve also show that they’re useful for predicting future performance. Two years down the line I have a larger sample of Premiership data to work with, so it’s time to update that.
So, as with total shots, lets split shots on target into four categories – for, against, differential, and ratio, and see how they stack up versus the metrics I’ve already looked at – a summary of which may be found at the bottom of this post.
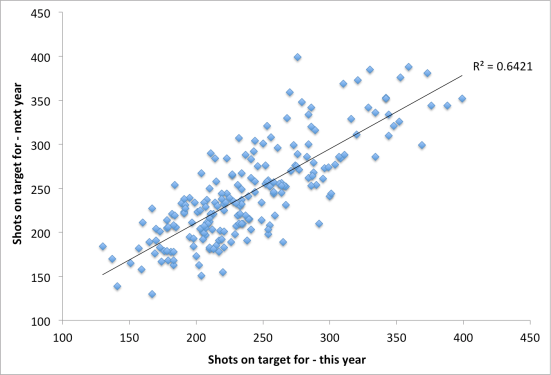
First up, this is the ‘shots on target for this year’ vs ‘shots on target for next year’ taken by a given team in year ‘n’, and year ‘n+1’.
As with total shots, there’s a decent correlation, and the breakdown is 80% skill and 20% luck.
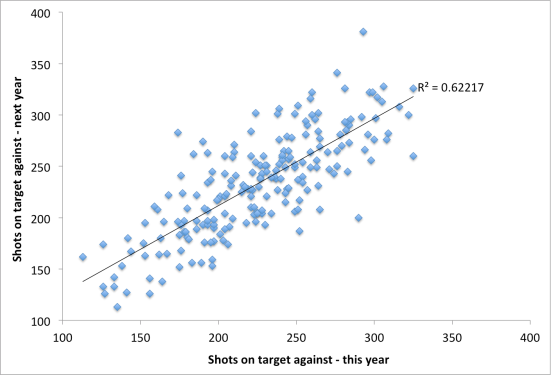
Next, lets take a look at shots on target against.
Unlike total shots (but like every other metric studied thus far), the correlation is weaker for the defensive version than the attacking version, although in this case it’s close – breaking down as 79% skill, 21% luck.
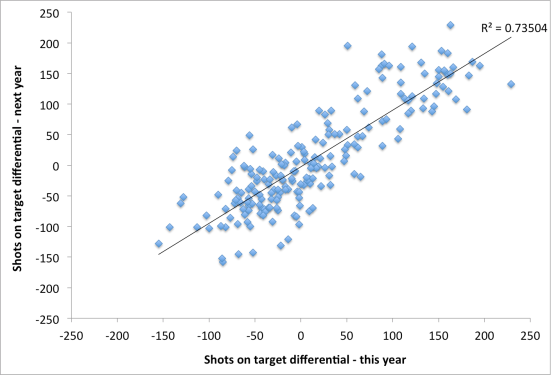
Thirdly lets look at shots on target differential over the course of a season.
Once more the correlation improves when we include shots at both ends of the pitch. And once more we’re up to 86% skill/14% luck (it’s close, but in decimals shots on target are marginally ahead of total shots in this category).
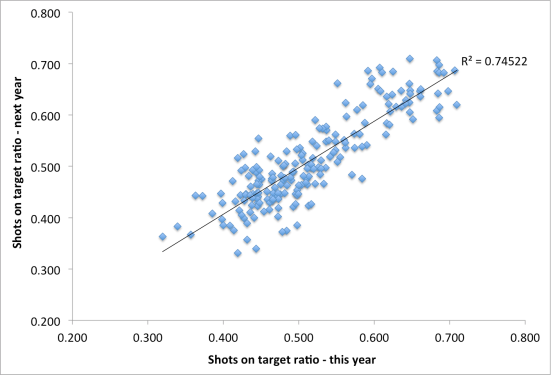
Finally we’ll move on to shots on target ratio, defined as shots on target for/(shots on target for + shots on target against).
Again, it’s incredibly tight, and the skill/luck breakdown still stands at 86/14, but shots on target over the course of a season are very marginally more repeatable than total shots.
I can basically copy and paste the summary from the total shots post: shots on target are an excellent indicator of how good a team is. The fact that they stabilise early on in the season is really useful too. Treating all shots on target equally is clearly flawed, and yet we can do a damn good job of predicting the Premiership next season knowing only a teams TSR from this season with no adjustment for score effects, personnel changes, or shot quality.
Finally, below is a table summarising this series so far, with each metric broken down into its skill and luck components. Skill and luck are defined therein in the context of ‘the repeatability of metric ‘x’ is ‘y%’ skill driven, and ‘z%’ luck driven at the team level over the course of a Premiership season. Click on the names of any of the metrics to be taken to the post with the relevant plots posted.
(1) = A special thanks to Infostrada for the data that made the original post possible
(2) = A special thanks to Dan Kennett for the data that made the original post possible


Thanks for publishing these series. Excellent work.
Have you looked at individual correlation of a player’s shots and shots on target with goals over the course of the season?
Your blog has opend up a whole new way of looking at soccer stats for me, and i’m very happy i found this site 🙂 I’m quite new to this and just trying to wrap my head around all of this. An earlier post introduced the TSR2.4 as the most repeatable value from year to year, but it’s not listed in the table above. I’m curious to wether it’s still the gold standard. Also I’ve seen earlier that TSR outperformes SOTR especially in the beginning of the season. Do you switch from using TSR to SOTR as the season progresses or is it just too little of a difference to matter?
Thanks for the kind words.
I suspect it would still be the best however I don’t feel the small improvement is worth the added complication of explaining why it’s useful. Also it’s benefit is mainly felt at the beginning of the season. In terms of switching to shots on target I tend not to bother. Again there’s only a minimal benefit, and sticking to one tends to avoid confusion amongst those reading the work.